AI-powered Analytics
Insights & Monitoring
Scryer monitors your Shopify store across the board and surfaces actionable recommendations. It's like having a professional e-commerce analyst on your team.
See what's breaking
When revenue drops or customers stop converting, we investigate why. Get the exact problem, root cause analysis, and a clear fix - not just data.
Find your best customers
Stop treating all customers the same. We automatically identify who's buying, who's just browsing, and what makes the difference between the two.
Track what's working
See if your changes actually moved the needle. We connect the dots between what you fixed and how your business responded over time.

Install in one click.
No sign up required.
Install the app
Scryer is a Shopify embedded app, accessible directly through the Shopify app store. All data integration is automatically handled for you.
Generate first report
It takes 2-3 minutes for Scryer to analyze your store for the first time, making use of state-of-the-art algorithms and machine learning models.
Start exploring insights
Your first report will feature insights specifically tailored for your business and situation. Later on, behavioral analysis will surface visitor cohorts.
Scryer actually understands your store.
Most AI tools run a one-off script that classifies data. Scryer hooks into your store data and starts watching what's happening, continuously.
What we monitor
Visitor Behavior Tracking
Lightweight pixel tracks how visitors navigate, interact with products, and progress through checkout
Shopify API Integration
Real-time access to your products, orders, customer data, and inventory for complete business context
AI Website Exploration
AI systematically analyzes your store's performance, usability, and technical factors affecting conversions
How we analyze it
Data Processing Modules
Statistical analysis and pattern detection algorithms
AI Interpreters
Semantic analysis and business context understanding
AI Orchestrator
Coordinates analysis workflow and delivers final insights
Ready to unlock your store's potential?
Get Started For FreeEverything you need
to understand your business
Stop guessing what's wrong with your store. Get clear, actionable insights with detailed claims, action steps, links, and metrics - everything you need to get things done.
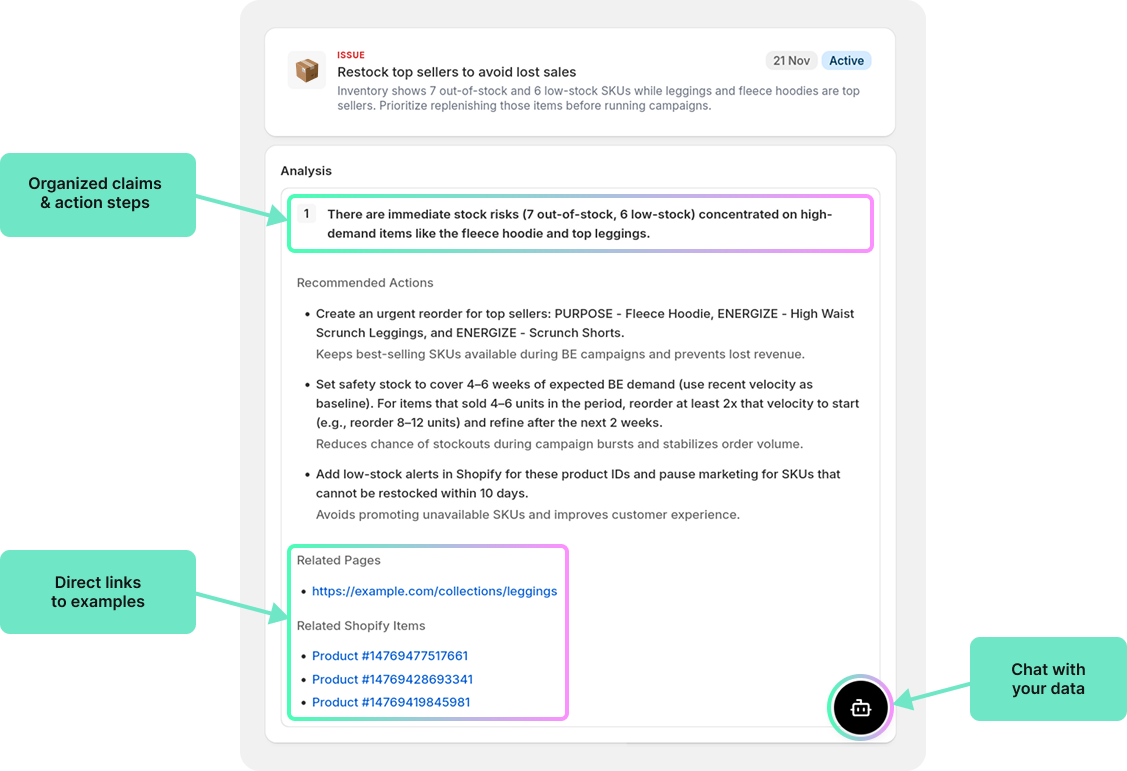
See the full picture
Every insight comes with organized claims backed by data analysis, clear recommended actions you can take immediately, and direct links to the exact products or pages that need attention. No more guessing what to fix or where to start.
Get the full context behind each insight with detailed analysis, related Shopify data, and step-by-step implementation guides. Chat with our AI assistant to dive deeper into any insight and get personalized recommendations for your specific situation.
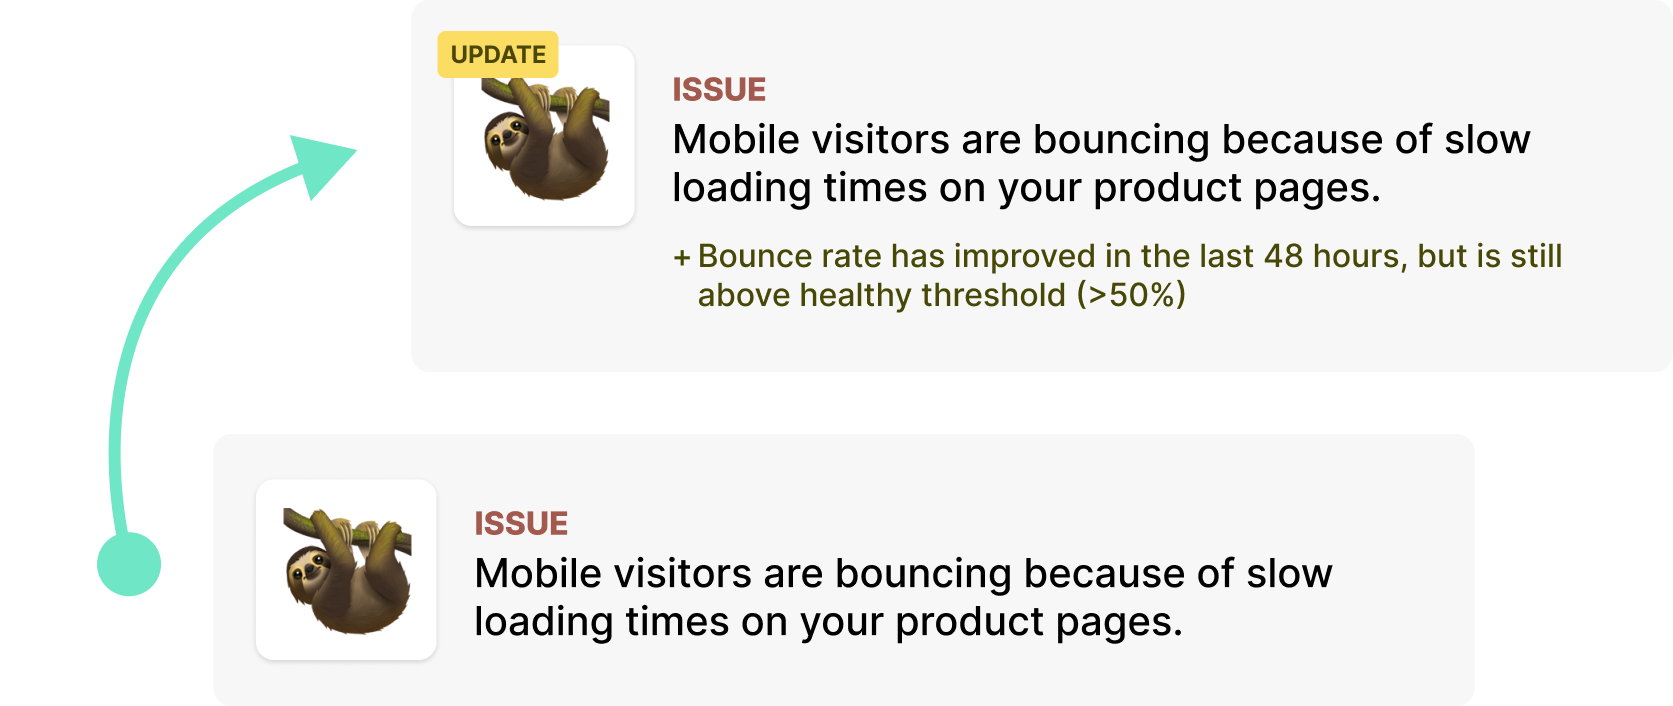
AI insights that evolve
Our AI automatically detects issues, opportunities, anomalies, and trends in your store. Each insight is managed by our AI orchestrator with complete lifecycle tracking - insights can be resolved automatically or by you, maintain full update history, and are benchmarked against similar businesses to provide relevant context.
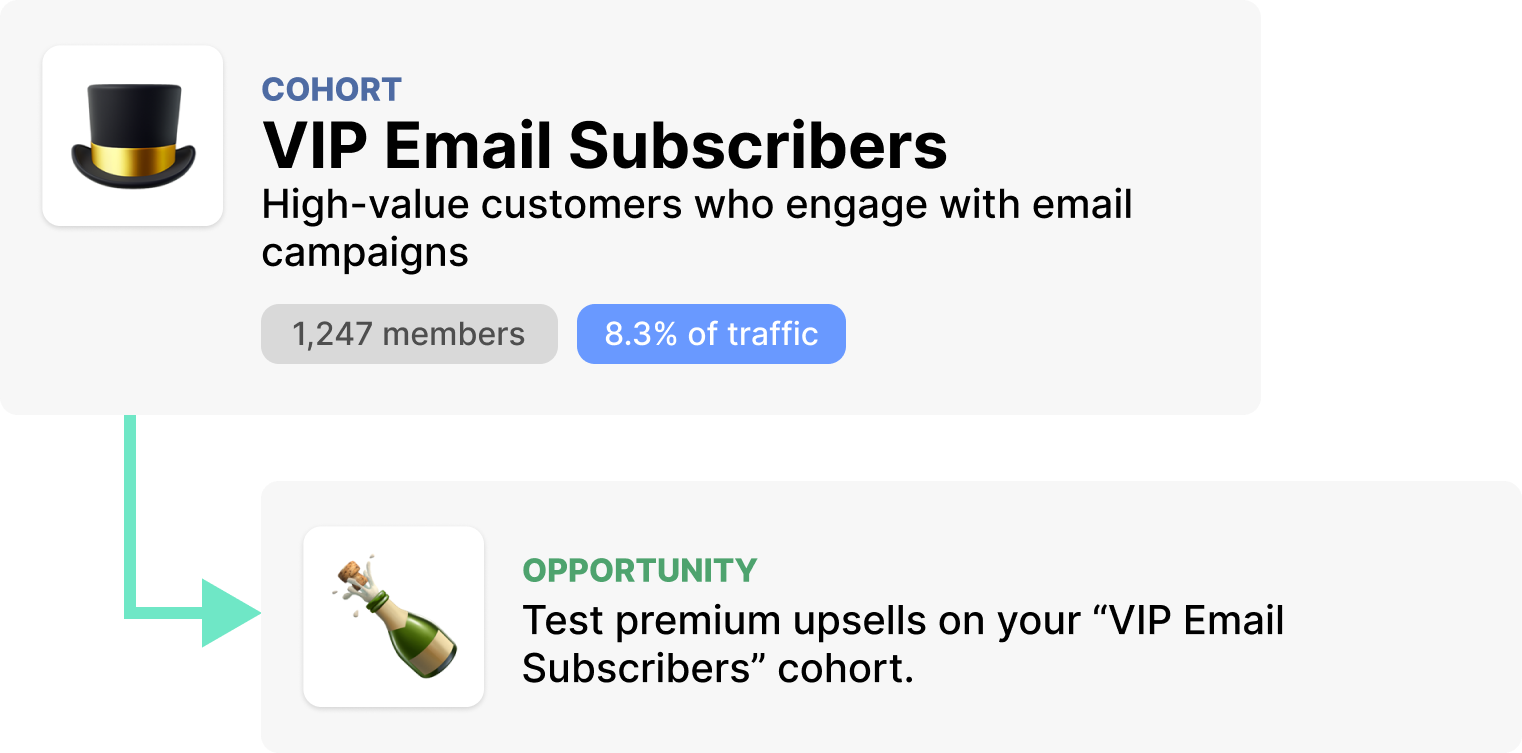
Connect insights to behavioral cohorts
Automatically discover visitor and customer segments based on behavior, purchase patterns, and preferences. These cohorts provide a high-level understanding of different visitor types and are automatically linked to relevant insights, helping you understand which segments are driving specific behaviors or issues.
Ask anything about your store
Chat with our AI assistant to understand your insights, explore your data, and get personalized recommendations.
Hidden issues are costing you
more than you think
Find and fix just one conversion issue, and Scryer pays for itself many times over.
$29/month
Standard Plan - Essential insights for growing stores
$89/month
Premium Plan - For professional workloads
No setup required • Cancel anytime